
Crunching data provides clearer image of organizational diversity.
by Mr. Thom Hawkins
You can never be sure, when you look in a mirror, that what you see is what other people see. For an organization, measuring diversity can elicit the unsettling images of a funhouse mirror, and standing too long in front of the mirror that makes us look tallest or laugh the hardest will not reveal how we truly look. So, how do we know if our ideas of diversity mirror those of others? How can we create the healthiest, most genuinely and appropriately diverse workplace possible? What is the right mirror to use?
According to U.S. Equal Employment Opportunity Commission (EEOC) Management Directive 715, an organization conducting a self-assessment “shall compare their internal participation rates with corresponding participation rates in the relevant civilian labor force. Geographic areas of recruitment and hiring are integral factors in determining ‘relevant’ civilian labor force participation areas.”
Oh, shall we? Examples, please! Except no examples are forthcoming from the EEOC, and our review of Management Directive 715 reports from across the federal government found that even when an agency is relatively centralized geographically (for example, the National Institutes of Health), it used the Department of Labor’s National Civilian Labor Force (NCLF) data as a point of comparison, and applied the term “relevant” only to limit the occupations considered, not the region.
The U.S. is hardly homogeneous, from a demographic perspective. The population of Washington state, for example, is considerably different from that of Washington, D.C. There’s more than two letters that separate Kansas and Arkansas. And while Hawaii and Rhode Island are both small states, it’s safe to assume that there’s a much higher percentage of native Hawaiians or Pacific Islanders in Hawaii than in any other state—and probably very few actual islanders in Rhode Island. So, adjusting a single organization’s demographic makeup to fit a national profile is like going on a diet because a curved mirror is making you look fat.
It’s not you, it’s your mirror.
FINDING YOUR MIRROR
Some organizations may indeed have so many of their employees dispersed across the country that using the NCLF data is the only appropriate comparison. However, short of rapid advances in plate tectonics, we are not going to radically shift a region’s demographic makeup—but we can adjust our recruitment to ensure a representative selection from the surrounding area.
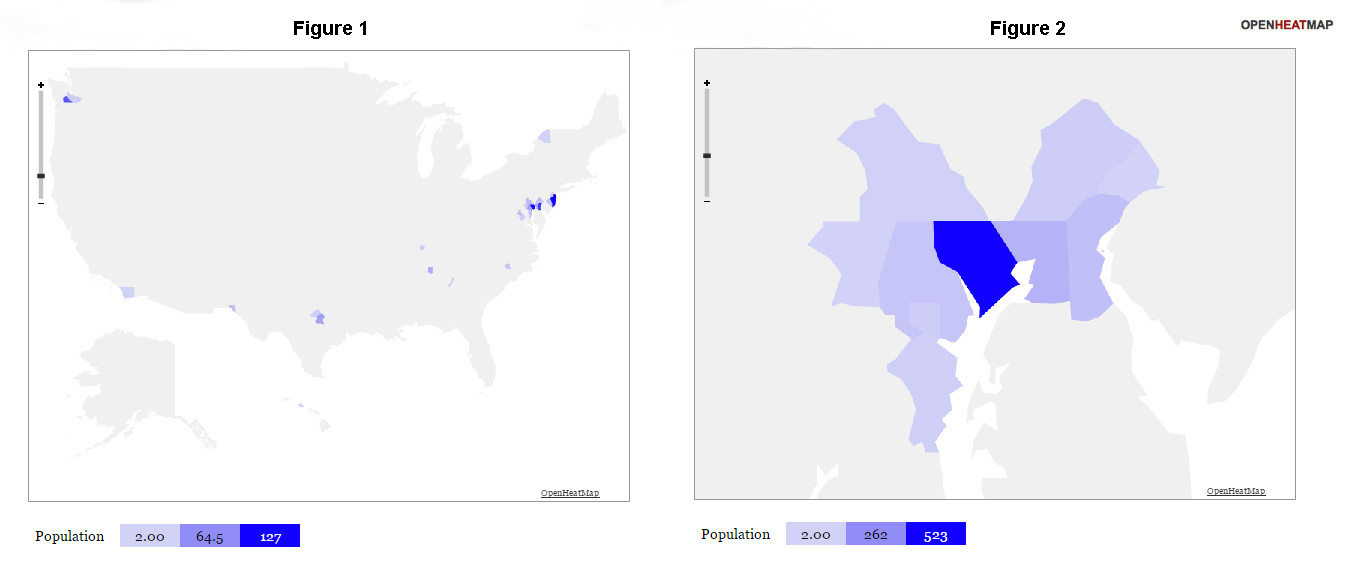
The Program Executive Office for Command, Control and Communications – Tactical (PEO C3T) is based at Aberdeen Proving Ground, in Harford County, Maryland. To identify the area from which we might expect to draw our workforce (for example, Harford, Cecil and Baltimore counties), we first looked at the location of our current workforce. Using the Manpower Information Retrieval and Reporting System, our workforce accountability system, we identified how many employees lived in each ZIP code across the United States. We then summed up the employees by ZIP code into counties and generated a population map using Open Heat Map. (See Figure 1.)
THE VIEW FROM UP HERE
PEO C3T mapped and examined national and regional census data to determine whether the demographics of its workforce mirrored national and local demographics, in response to U.S. Equal Employment Opportunity Commission (EEOC) Management Directive 715. (Image courtesy of the author and OpenHeatMap.com)
In addition, we found that we had a number of employees who commuted from central and northern New Jersey, at least partly because of base realignment and closure measures that moved command, control, communications, computers, intelligence, surveillance and reconnaissance professionals from Fort Monmouth, New Jersey, in 2010. Because we are not actively recruiting residents from New Jersey for our current location in Maryland, we also eliminated those data from the analysis. The final result showed a concentration of employees around Harford County. (See Figure 2.)
Using the population map, we determined that an appropriate regional composite should include Harford County, any county sharing a border with Harford County, and any county that shares a border with a county bordering Harford County. To create the demographic makeup of the regional composite, we used data from the U.S. Census (2015 projection), adjusted proportionally based on the percentage of our workforce currently residing in each of those counties. Approximately 64 percent of our current population resides in Harford County; therefore, we multiplied each of Harford County’s demographics by 0.64 so that 64 percent of our regional demographic would “look like” Harford County. For example, Harford County’s population is 4.3 percent Hispanic or Latino, so we multiplied 0.043 by 0.64 to calculate Harford County’s share of our region’s Hispanic or Latino population. We added that to the product of Cecil County’s 17 percent of our workforce and that county’s 4.2 percent Hispanic or Latino population, etc.
Because census data are separate from labor data, we compared national census data to national labor participation rates for women and men and adjusted the ratio in our regional population accordingly, to account for different levels of labor participation by women and men. We assumed that there was no difference in labor participation based on race. Figure 3 shows the different diversity profiles for the NCLF and the federal workforce, and a demographic profile we developed based on the region from which we, PEO C3T, expect to recruit our workforce.
MIRROR, MIRROR, ON THE WALL …
The question “how diverse are we?” can be partially answered with EEOC statistics. But it begs a second question—“how diverse should we be?” After all, “diverse” is a relative term, so it only makes sense in comparison. We could directly compare our organization’s diversity profile with the profile of our region, but if we were 1 percentage point below, does it mean we are falling short? How far off is it OK to be? For that matter, if we were 1 percentage point up somewhere, it would mean we were down somewhere else and we would forever be chasing a perfect balance. What is more important is that there is no evidence of bias—and to look for evidence of bias, we can use statistics.
If we had a jar with seven blue marbles, 10 red marbles and eight green marbles, and I reached in and pulled out only the eight green marbles, what is the probability that this selection was made at random? It’s certainly unlikely, though possible. It is more likely that there was some type of bias involved. Maybe I like green marbles. Or maybe the green marbles were lighter than the blue and red marbles and shifted to a more accessible position when I tilted the jar to reach in. Whether the biased selection was intentional or not, the fact that my selection was unlikely to be pulled at random from the larger population means that we should investigate the cause.
ARE YOU LOOKING AT ME?
Using census and demographic data to inform adjustments in recruitment can ensure a representative selection from the region in which an organization is based, as well as a mix of perspectives and experiences that yields a stronger, more innovative workforce. (Image by the U.S. Army Acquisition Support Center)
With employees, the bias could be that we hire a lot of engineers, and women are underrepresented in the field of engineering. This raises some questions we then need to consider: If we try for equal representation, is that another form of bias? Do those positions actually require an engineering degree, or are we hiring engineers out of habit? What can we do to affect change at the root of this problem—that is, how can we ensure a more diverse field of candidates in the engineering discipline?
We used a two-proportion test to determine whether the difference in proportions for a particular demographic was within the range of expected variability, the first proportion being the target demographic and the other proportion being the sum of all other demographics. The result tells us how likely it is that we have the demographic proportions that we do if we hired our workforce at random from the population in our region.
When the data indicated that a particular demographic was underrepresented in our organization, we considered the underlying causes or types of bias, and how the result would impact our recruitment strategy. In some cases (e.g., American Indian or Alaska Native, Native Hawaiian or Pacific Islander), the proportions were too low for a valid statistical test; those we did not target for action.
CONCLUSION
Identifying where our organizations’ diversity differs significantly from our region will allow us to develop an appropriate recruiting strategy, like increasing our presence at predominantly female or African-American college and university job fairs, without chasing after unachievable metrics. In the end, we will have to move beyond objective EEOC metrics because we are seeking a workforce that possesses diverse backgrounds, experiences and ways of thinking, a workforce that will bring together varied perspectives to solve problems as a team.
Statistical analysis has moved us out of the funhouse and allowed us to create a mirror that captures an accurate image of our organization’s personnel appearance. With such a mirror in place, we can now see our community in the reflection of ourselves.
For more information, contact the author at jeffrey.t.hawkins10.civ@mail.mil. For more information about PEO C3T, go to http://peoc3t.army.mil/c3t.
MR. THOM HAWKINS is the chief of program analysis for PEO C3T. He holds an M.S. in library and information science from Drexel University and a B.A. in English from Washington College. He is Level III certified in program management and Level I certified in financial management, and is a member of the Army Acquisition Corps. He is an Army-certified Lean Six Sigma black belt and holds project management professional and risk management professional credentials from the Project Management Institute.
This article is scheduled to be published in the July-September 2017 issue of Army AL&T Magazine.