There’s a proven way to drive down defense acquisition costs, and it works especially well for the complex, high-tech platforms prone to big cost overruns. You’ve heard of it: the learning curve. It drives down defense acquisition costs the old-fashioned way.
by Mr. Sudhakar Arepally
Major League Baseball’s Chicago Cubs waited 108 years to finally win the World Series championship in 2016. It has not been that long—30 years or so—since the Army launched a major combat ground vehicle program, but the drought is conspicuous and frustrating nonetheless. The Army’s “Big 5”—the M1 Abrams main battle tank, the Bradley fighting vehicle, the UH-60 Black Hawk, the AH-64 Apache and the Patriot missile system—all date to the 1980s. The Army’s initiatives to introduce major ground combat vehicle platforms over the past 10 years—for example, Future Combat Systems and the Ground Combat Vehicle—have not succeeded.
The Army terminates acquisition programs for a variety of reasons. Tectonic shifts in the operational capability requirements, while rare, can put the brakes on an otherwise well-managed program. So can external factors, such as political indifference and bleak economic circumstances. However, the irrevocable damage more commonly stems from unwieldy performance requirements, program schedule slips and cost overruns. Mostly, the underlying causes are unanticipated vehicle engineering, developmental and manufacturing roadblocks and inadequate measures to mitigate risks of unproven and complex technologies. Eventually, these issues escalate to create unbearable program costs.
Fortunately there are promising approaches to manage program costs more strategically, employing pragmatic economic principles and enforcing a long-term business view. One of these principles, recognized in the 1940s and widely used in the manufacturing industry today, is the experience curve, sometimes referred to as the learning curve. Put simply, it describes this economic advantage: A firm that produces a complex product over time learns the process and thus is able to improve both productivity and performance across its functions and operations. This learning, in turn, enables the firm to reduce the unit cost of the product, as its cumulative production volume doubles over time. In general, firms that perform complex design, engineering development and manufacturing activities derive the most benefit from the experience curve.
THE ITEM IN QUESTION
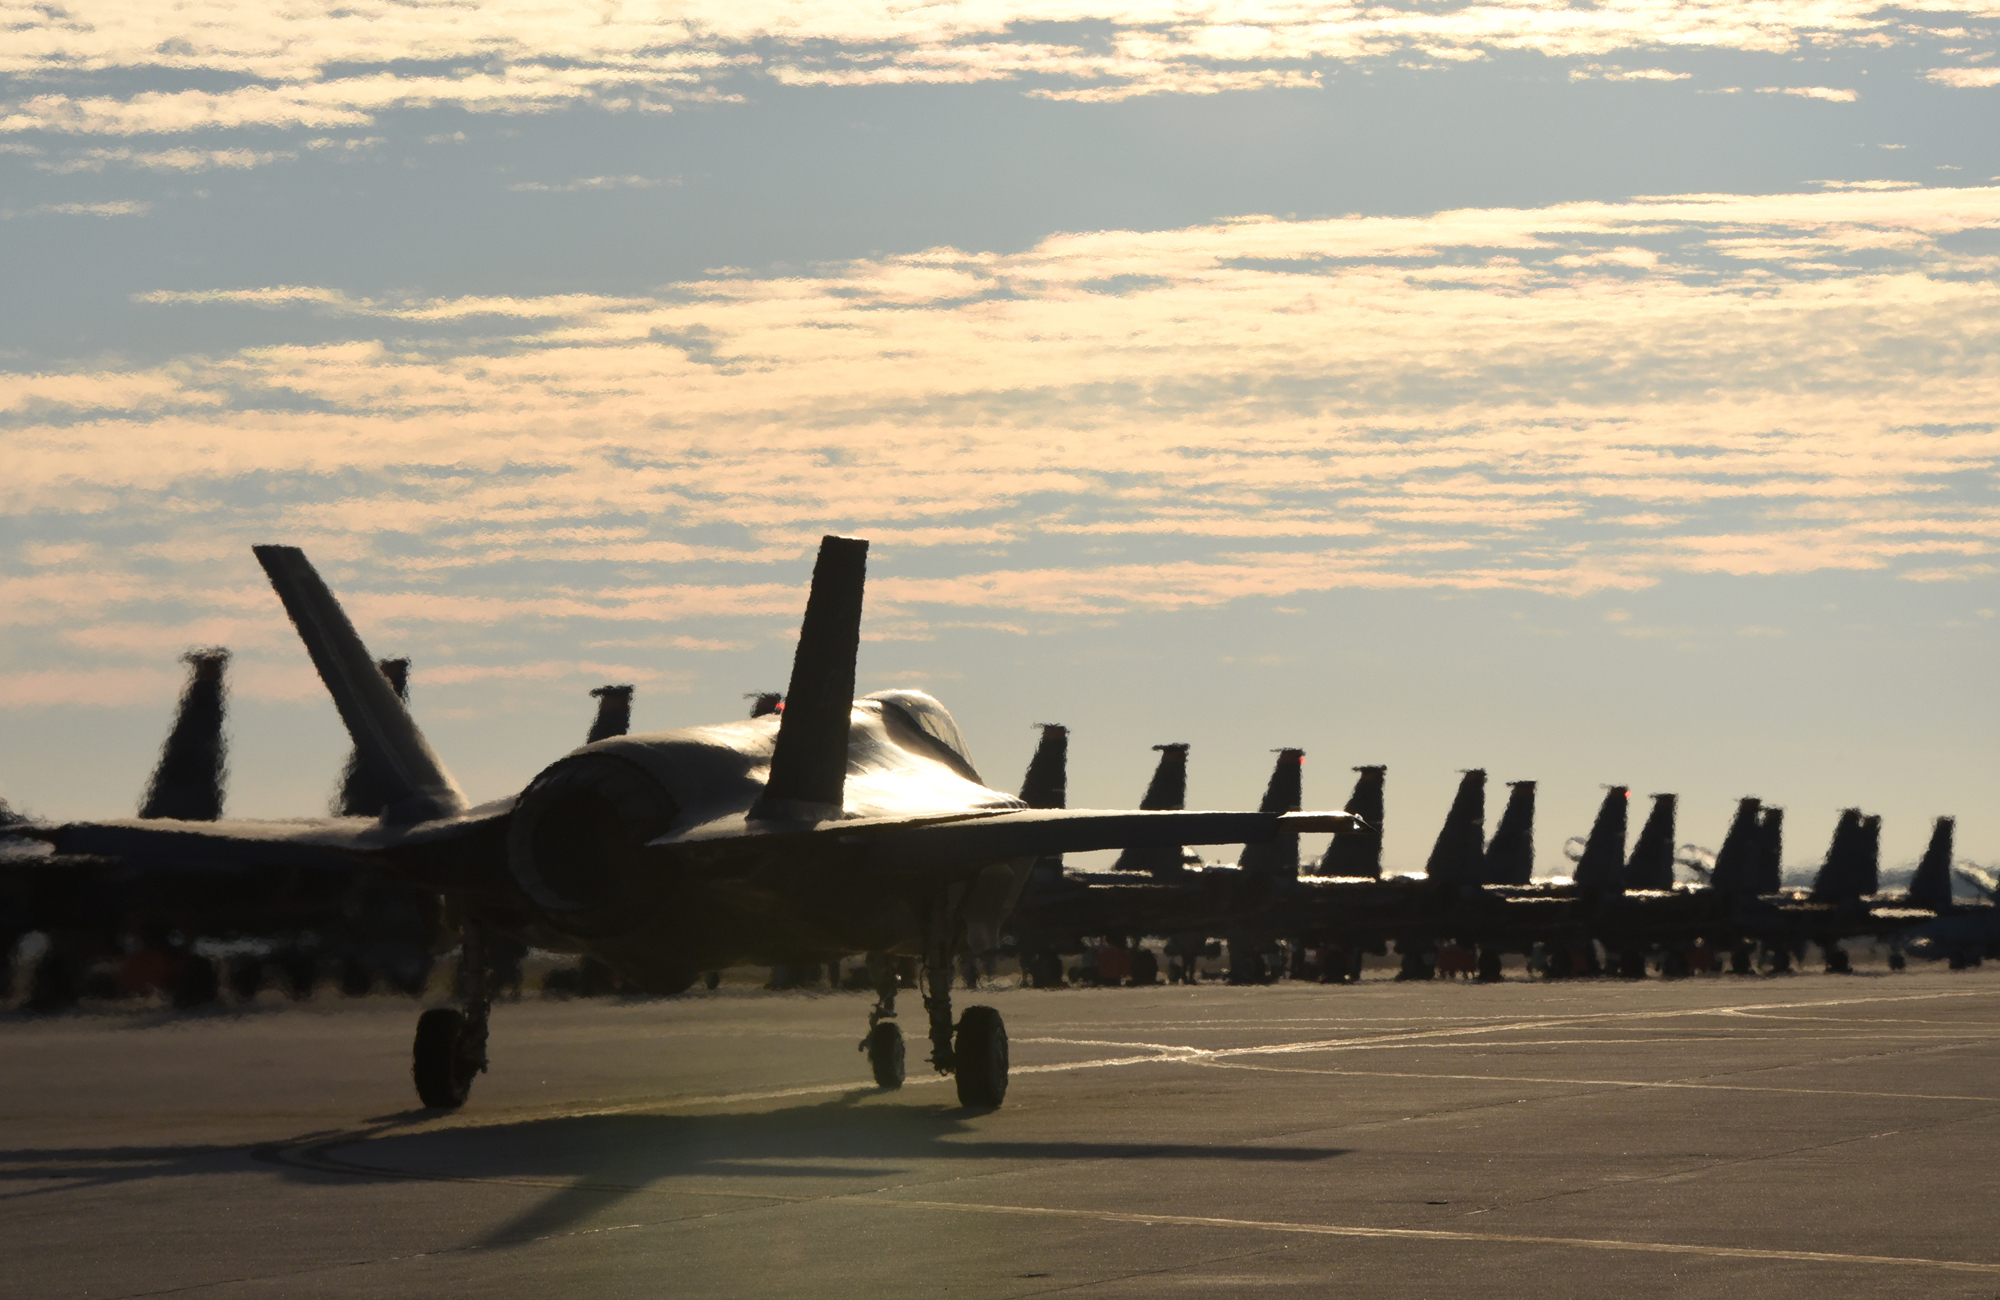
A U.S. Air Force F-35A Lightning II from Eglin Air Force Base, Florida, taxis down the flight line before takeoff at Tyndall Air Force Base, Florida, Dec. 8, 2016. The high lifetime and per-unit cost of the fifth-generation fighter plane have drawn criticism, including from the Trump administration. Each aircraft in the most recent batch cost less than $100 million, the first time per-item cost has dropped below that threshold. (Photo by U.S. Air Force Staff Sgt. Alex Fox Echols III)
HOW THE CURVE WORKS
There is ample and compelling evidence of the benefits of the learning curve in the manufacturing industry. As far back as World War II, aircraft manufacturing costs fell by roughly 20 percent because of decreases in labor hours each time the production volume doubled. Numerous generalized studies of other industries have corroborated the experience curve’s ability to reduce costs by anywhere from 5 to 30 percent.
More recently, a report on the F-35 Lighting II, a fifth-generation fighter aircraft recognized for its advanced stealth capabilities, speed and agility, states that more efficient manufacturing methods and processes will help drive down the per-unit cost of the fighter plane by $10 million by 2019. The manufacturer, Lockheed Martin Corp., attributes the improved methods and processes to continuous improvement initiatives. In a validation of the experience curve, Lockheed Martin stated that for the low-rate initial production (LRIP) 8 contract award, the average unit price of the airframes for the three F-35 variants was 3.6 percent lower than the previous LRIP 7 price.
Analysis of the cost data reinforces the merits of the economic concept. Plotting the actual F-35 cost data released by Lockheed Martin against the production run, a steep reduction in the unit cost is evident early in the production run but gradually levels off. (See Figure 1) Such a trend indicates not only the immediate impact of economies of scale—another economic principle that states that doubling the input more than doubles the output—but also exhibits the tremendous learning potential in a nascent production facility. However, as operations become mature and streamlined over time, the possibilities for realizing efficiencies decline.
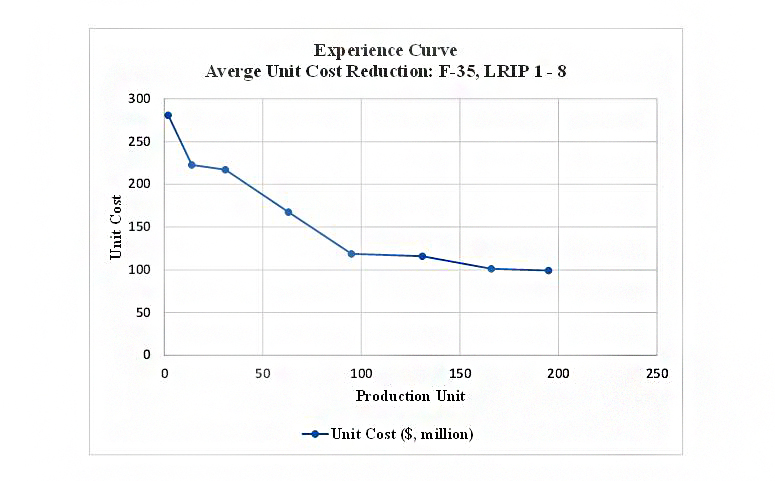
FIGURE 1: STEADY DECLINE IN UNIT COST
This experience curve shows the average per-plane cost reduction for the F-35 Lightning II from LRIP 1 to LRIP 8. The more units produced, the less each unit costs, as the manufacturer gains expertise over time. (SOURCE: Sudhakar Arepally, DASA(DE&C))
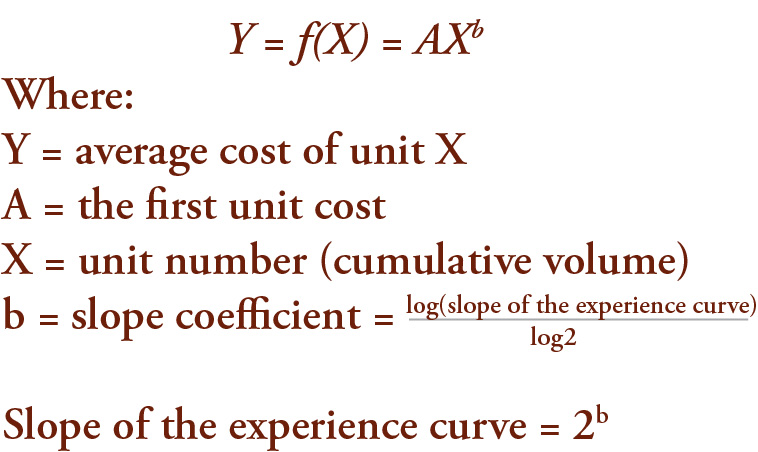
But it is worth highlighting the general shape of the downward sloping curve in Figure 1, a signature characteristic of the experience curve. It can be reduced to a mathematical function known as the power or multiplicative law, represented as follows:
A practical application of the model allows estimation of the average unit cost curve for future production units within reasonable bounds. (See Figure 2) Figure 2 shows the actual F-35 cost data (blue) versus the cost data estimated or predicted (red) by the mathematical model. Even though the curve profiles are similar, the differences in the absolute values are magnified in the initial production phase. It is possible that real-world situations, with effects on operations that the simple and approximate mathematical model does not reflect, might have contributed to the variation.
The 15.5 percent degree of decrease in the unit cost for the F-35 case is a noteworthy output of the model. In other words, every time the F-35 production output doubles, the average unit cost decreases by 15.5 percent. (In theory, this specific curve is denoted as the 84.5 percent experience curve, 84.5 being the difference between 15.5 and 100.) This reinforces empirical evidence from numerous studies supporting cost reductions from 5 to 30 percent.
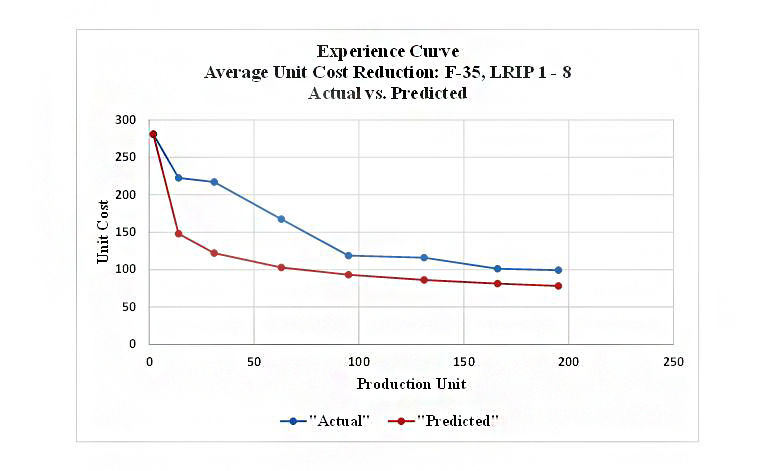
FIGURE 2: PREDICTED VS. ACTUAL DECLINE
The F-35’s actual cost over time, in blue, and predicted cost over time in red follow roughly the same downward path, but the absolute numbers are different, especially at the outset. Why the disparity? The mathematical model that generates predicted data is just that—a model—and can’t take into account some real-world events that can affect labor and part costs. (SOURCE: Sudhakar Arepally, DASA(DE&C))
THE EXPERIENCE CURVE AND ACQUISITION
As with the F-35 fighter aircraft, the Army, too, should be able to harness the cost benefits of the experience curve. The experience curve is all the more inviting to embrace because its advantages extend beyond labor hours saved to other functions across a firm’s (or service’s) operations. Both fixed and variable costs offer possibilities for lowering the cost structure with organizational learning. For instance, high-volume batch orders and long-term contracts could lower procurement costs.
The Army can accelerate the cost savings by routinely deploying industry best practices for achieving efficiencies: continuous improvement initiatives such as value analysis, value engineering and Lean Six Sigma to continually reduce or eliminate waste and cut costs while improving product quality. Even management and administrative functions, the “overhead” regarded as a necessary evil among customers, tend to shrink and become minimally burdensome when these practices are rigorously applied.
With reference to the Army’s acquisition process, the experience curve is most adaptable to the production and deployment phase marked by milestone (MS) C. To a lesser degree, it could benefit the system development and demonstration phase, denoted by MS B. But its prospects for the activities preceding MS A are projected to be marginal.
If we apply the experience curve approach to Army acquisition, as an integral part of the broader acquisition strategy for new Army programs, then program cost management over the long term is anticipated to be more disciplined. As a routine process, the acquisition team currently prepares an internal cost estimate before releasing the request for proposal (RFP) to defense equipment manufacturers before MS C. Along with several other performance criteria, the team weighs the cost parameters in the overall evaluation of contractors’ bid proposals.
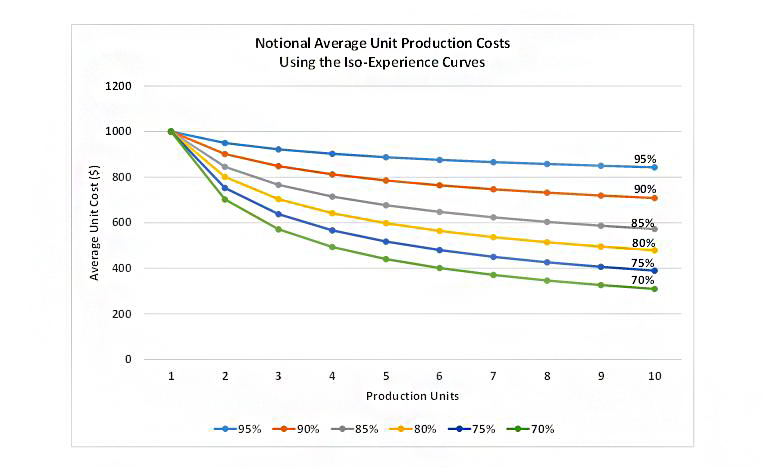
FIGURE 3: WHAT WILL THE NEXT ONE COST?
With an estimate of what the first item will cost, a series of curves can be generated to show how the per-item cost could drop over time, assuming a decline from 5 to 30 percent. Studies have observed the experience curve’s ability to lower per-item cost by those amounts. (SOURCE: Sudhakar Arepally, DASA(DE&C))
Given an estimate of average unit cost of the first article produced (e.g., the first unit of LRIP), a series of cost curves, henceforth called iso-experience curves, can be generated using the power law model. (See Figure 3) As Figure 3 shows, the iso-experience curves illustrate average unit cost reductions ranging from 5 to 30 percent (or conversely, the 95 percent experience curve to 70 percent experience curve). (See Figure 4)
Figure 4 shows the experience curves for a notional production run of 10 units. To understand the calculations, let us consider the values pertaining to the 95 percent experience curve. It is assumed the cost for the first unit is 1,000. To calculate the cost for the second unit using the model, the values of 1,000 (first unit cost), 2 (second unit), and -0.07 (slope coefficient corresponding to the 95 percent experience curve) are assigned to the variables ‘A’, ‘X’ and ‘b’. Using this information, the model produces a ‘Y’ value of 950. Similar calculations are employed to generate all the other ‘Y’ values in Figure 4, including the predictions for the 100th unit associated with the iso-experience curves.
Following contractors’ bid responses to the RFP, when the source selection evaluation board begins the evaluation process, is where the novelty of this notional approach becomes clear. Instead of rating a manufacturer’s proposal on a single and fixed cost estimate (along with other performance criteria), the manufacturers should be required to provide projections of unit cost reductions for the future production units. The government then would compare these against its own reference iso-experience curves generated before the RFP.
Without a doubt, the data would provide an indication of the contractors’ motivation to manage costs over the long run. For instance, if a contractor’s proposal indicates only a 5 percent average unit cost reduction for every doubling of production output and another contractor’s proposal demonstrates a 30 percent reduction, such a glaring difference in cost structure would require further scrutiny. It might also reveal how determined contractors are to pursue innovative approaches to lowering costs. Both insights are a win for the Army acquisition process.
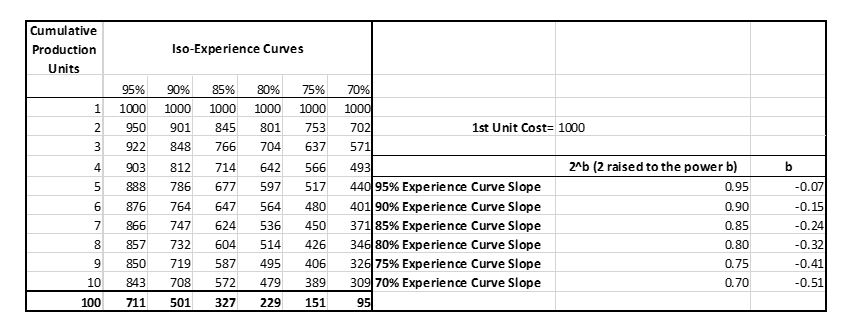
FIGURE 4: EVALUATE THE ESTIMATE
The calculations that underlie the notional cost curves in Figure 3, assuming a production run of 10 items. One way to make the source-selection process more rigorous would be to evaluate not just the absolute cost that manufacturers propose, but how much they could lower the per-item cost over time. The manufacturers’ estimates could be compared to model-generated estimates, to evaluate whether or not the manufacturers are prepared to fully exploit the experience curve’s ability to save money over time. (SOURCE: Sudhakar Arepally, DASA(DE&C))
CONCLUSION
Defense industry manufacturers need to be aware of cost-cutting opportunities and should create an environment in which the workforce wholeheartedly embraces best practices for efficiency and effectiveness. Only then will opportunities for cost reduction come to fruition. The defense acquisition community, in turn, should recognize the long-term benefits of the experience curve in galvanizing the industrial base.
To that end, the acquisition community should take necessary measures to maintain continuity of production operations. One such approach is to balance the demand for defense articles, stretching production over longer periods as opposed to intermittent bursts of production to avoid generally exorbitant costs of manufacturing start-up and shut-down costs.
In December 2016, President-elect Trump voiced his concerns about the high acquisition costs of defense products and singled out the F-35 aircraft. While a price drop for the F-35 was already in the works, according to defense market analysts, Lockheed Martin credited Trump with accelerating the reduction. In February 2017, the company announced an average cost reduction of 7.5 percent, or $455 million, for the government’s purchase of 55 planes, compared with the previous lot. Notwithstanding Trump’s conversations with Lockheed Martin, it is no surprise that the overall savings were a dividend of the experience curve.
Considering the economic concept’s financial implications, future Army programs should consider the calculus early in acquisition planning. As old-fashioned as it may be, the experience curve method is a source of optimism for cost management of large and complex Army programs. Just like the Chicago Cubs, whose extraordinary preparation and performance resulted in their long-awaited victory, the Army should posture now for a win when it embarks on a new major platform. It is time to put an end to the long dry spell.
For more information, contact the author at sudhakar.r.arepally.civ@mail.mil or (703) 545-9102.
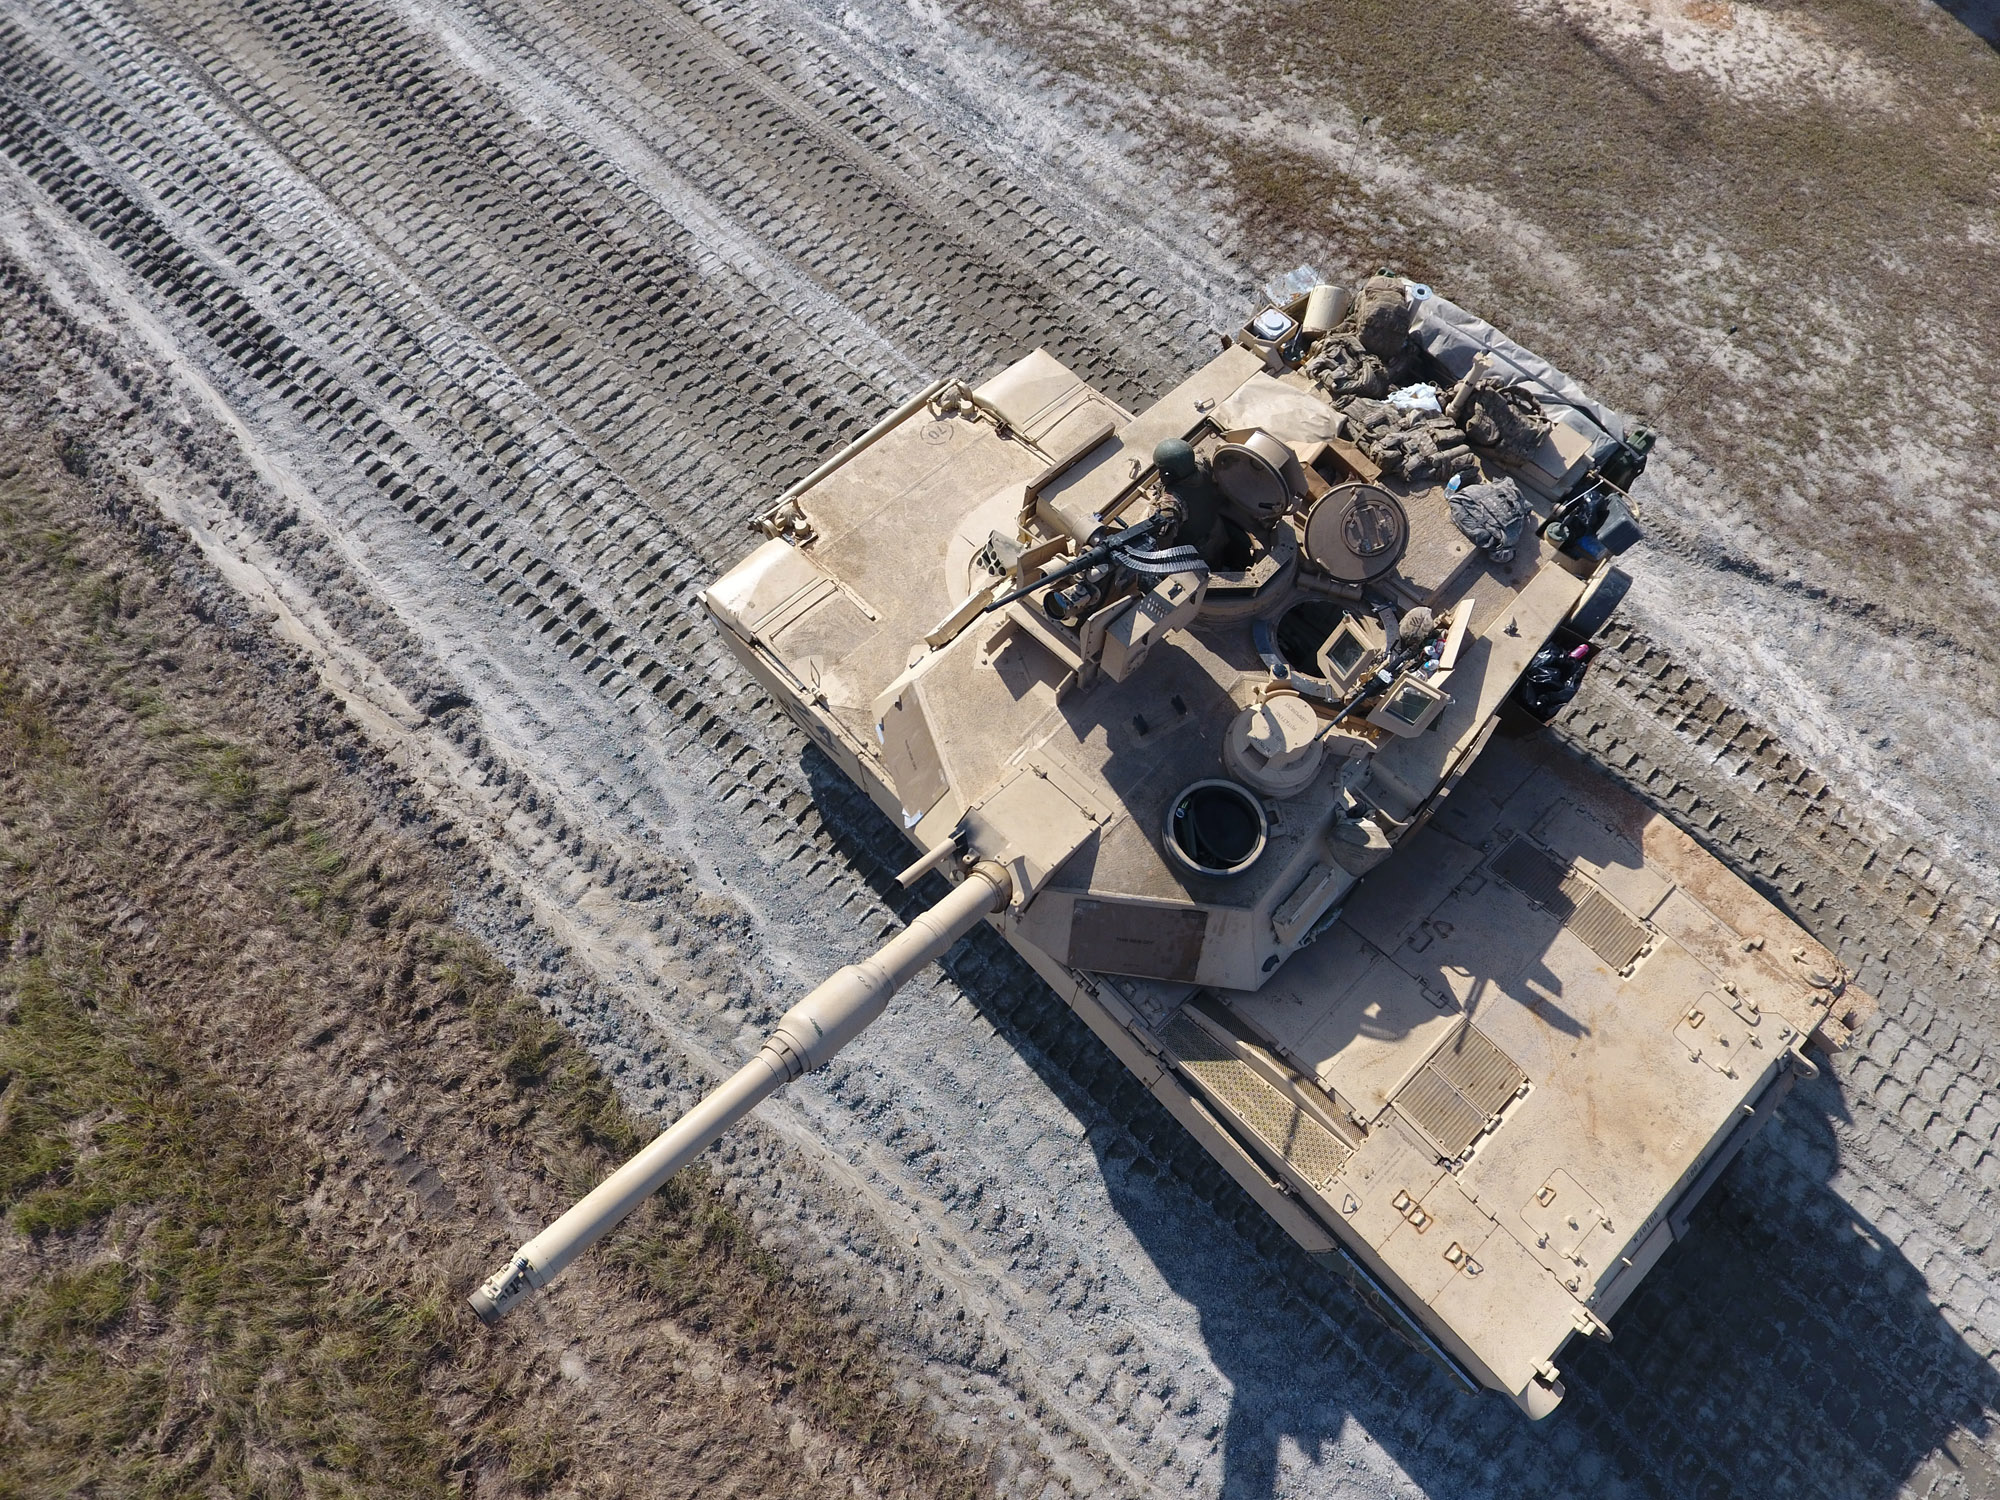
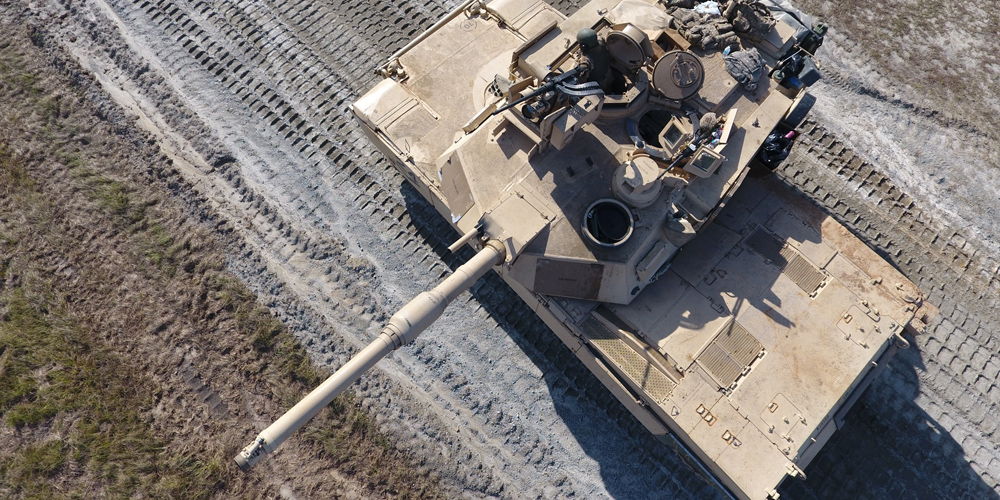
BIG TANK, BIG COST, BIG LEARNING-CURVE POTENTIAL
This Abrams tank from the 1st Armor Brigade Combat Team, 3rd Infantry Division, shown here in a December 2016 aerial drone image at Fort Stewart, Georgia, is one of the Army’s “big five” combat platforms, all of which date from the 1980s. Several attempts to launch a new ground-combat platform have fallen victim to soaring costs; the learning curve could offer a simple, time-tested way to control the cost of big, complex manufactured items like the Abrams or its successor. (Photo by Master Sgt. Erick Ritterby, 3rd Infantry Division)
MR. SUDHAKAR AREPALLY is on a one-year developmental assignment in the Office of the Deputy Assistant Secretary of the Army for Defense Exports and Cooperation, Arlington, Virginia. He is tasked with developing internal strategic plans. A graduate of the Senior Service College Fellowship program in May 2016, he served previously as associate director for systems engineering and analytics at the U.S. Army Tank Automotive Research, Development and Engineering Center, where he was responsible for planning, directing, reviewing and coordinating efforts in computational modeling and simulation. He also has extensive private industry experience, having worked as a senior project engineer for General Motors Co. and as a senior project engineer and program manager for what was then TRW Automotive Systems. He holds MBA degrees from Lawrence Technological University and the University of Michigan, an M.E. in industrial engineering from Tennessee Technological University and a B.E. in mechanical (production) engineering from Andhra University. He is Level III certified in engineering and a member of the Army Acquisition Corps.
This article is scheduled to be published in the July-September 2017 issue of Army AL&T Magazine.